7.8 Land evaluation - LUPMISManual
Main menu:
7.8 Land Evaluation / Land Suitability
Level of expertise required for this Chapter: Advanced; specifically for LUPMIS @ TCPD
Planning requires ‘siting’ of specific land uses for the best available place taking into consideration essential factors such as safety, access, engineering feasibility, soil, economic, technical and environmental conditions etc.
In a more advanced interpretation it is possible to overlay the individual layers, which have an impact on planning, to assess the land showing suitable (and unsuitable) areas for a particular land use.
This process is called land evaluation, showing the land suitability, at GIS for land use planning also called ‘siting analysis’.
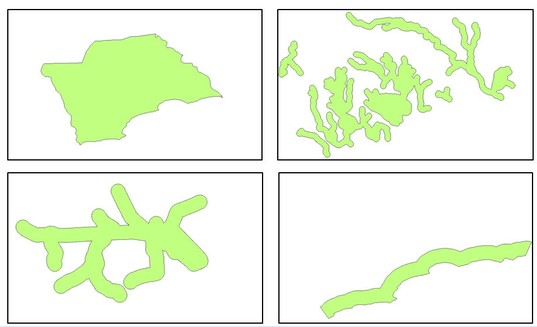
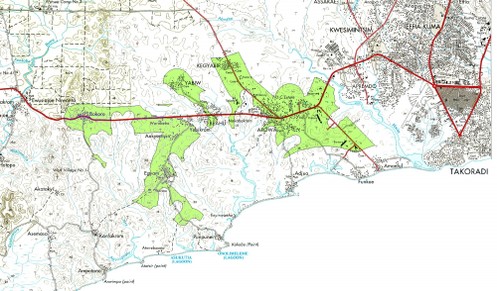
In the example below, there are four layers considered:
Structure Plan area: All considered land should be within the area defined by the planning authority.
Buffers along the main rivers: All considered land should be outside of the potentially flooded area (see also Chapter 3.1 for buffering)
- Buffers along the roads: For accessibility, all considered land should be within easy reach (short distance) of a road (see also Chapter 3.1 for buffering)
- Buffers along the coastline: For ecological conservation and for tourism all considered land should be outside of a coastal strip (see also Chapter 3.1 for buffering)
In a real planning scenario, there might be the need to consider more layers, such as ownership, agricultural suitability (soil, topography, climate, drainage), slope etc.
The general process is listed below:
- 1. Buffering, if necessary (in GIS, see Chapter 3.1)
Note: The buffer zone should have a style number greater than 0
- 2. Intersecting all layers (in GIS, see step 1.1 of Chapter 4.5)
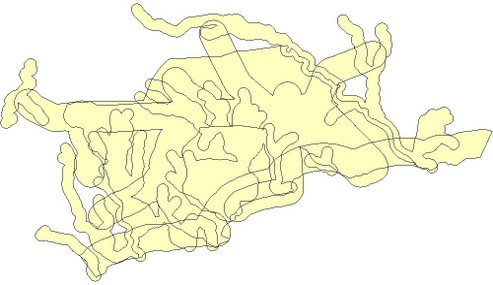
- 3. Importing (‘indent’) attributes of the land of each layer (in GIS, see step 1.2-1.11 of Chapter 4.5)
- 4. Defining the interaction formulae between all layers (in spreadsheet, see Part 2 of Chapter 4.5 and explanations below)
- 5. Display the units, which are suitable (in GIS, see Part 3 of Chapter 4.5)
- - - -
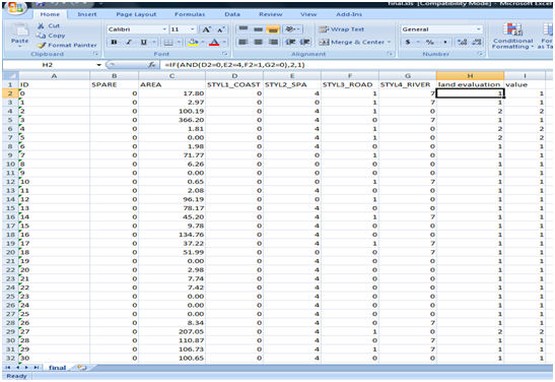
The calculation in a spreadsheet like Excel might require some explanations:
STYLE1_COAST refers to the coastline buffer
STYLE2_SPA refers to the layer containing the Structure plan area
STYLE3_ROAD refers to the layer containing the buffered road layer
STYLE4_RIVER refers to the layer containing the buffered river layer
If the precondition is met, that all covered areas, including buffer areas, have a style greater than 0, a 0 in the spreadsheet cell indicates, that this area is outside.
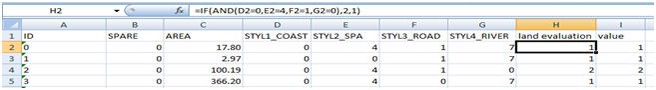
In the example above, row 2:
Under STYLE1_COAST (coast buffer layer) has a value of 0 meaning it doesn’t fall under the coast buffer.
Under STYLE2_SPA (structure plan area) it has a value of 4 meaning it falls within the structure plan area.
Under STYL3_ROAD (road layer) the value is 1 meaning it falls under the road buffer.
Under STYLE 4_RIVER (river layer) has a value of 7 meaning it falls within the river buffer.
IF function in Excel
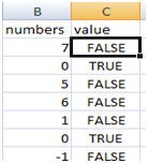
The IF function returns one value if a condition you specify evaluates to TRUE, and another value if that condition evaluates to FALSE. It is written as:
=IF(logical_test, value_if_true, value_if_false)
For example: =IF(B2=0,true,false) will return True if B2 is equal to 0 and False if B2 is not equal to 0.
AND function in Excel
A common use for the AND function is to expand the usefulness of other functions that perform logical tests. For example, the IF function performs a logical test and then returns one value if the test evaluates to TRUE and another value if the test evaluates to FALSE.
By using the AND function as the logical test argument of the IF function, you can test many different conditions instead of just one. It is written as:
AND (logical1, [logical2], ...)
logical1:The first condition that you want to test that can evaluate to either TRUE or FALSE.
logical 2: Optional. Additional conditions that you want to test that can evaluate to either TRUE or FALSE
e.g. ...AND(B2=0,C2=1,......)
To identify the area that meets the above mentioned criteria for siting an industrial area the formula would be:
=IF(AND(D2=0,E2=4,F2=1,G2=0),2,1)
Using this formula means:
IF (an object in D2 has a value of 0 {i.e. is not within the coast bufferand the object in E2 has a value of 4 (i.e. within the structure plan area) and in F2 has a value of 1(i.e. within the road buffer) and in G2 has a value of 0 (i.e. outside the river buffer), the result should be “1” otherwise “2”.
Save as XLS file.
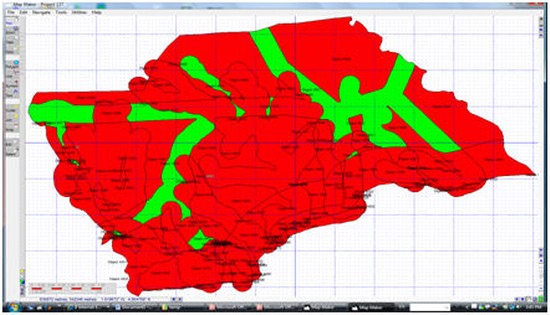
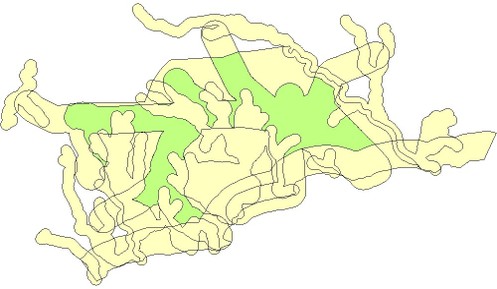
For display in Map Maker, see Part 3 of Chapter 4.5. The green areas in the example below indicate the sites suitable for siting industrial activity.